This blog has moved to Medium.
I recently came across an open-source Python DevOps framework Kedro and thought, “Why not have ChatGPT teach me how to use it to build some ML/DevOps automation?” The idea was to write my questions with hints that encouraged explanations of advanced Kedro features (to evolve incrementally as if a teacher taught me).
I planned to ask ChatGPT how to:
- Use basic Kedro.
- Use more advanced features in the Kedro framework.
- Display pipeline graphs in Streamlit.
- Build an example ML model and explicitly refer to it in the Kedro pipeline.
- Scale the pipeline and perform pipeline logging, monitoring, and error handling.
- Connect Kedro logs to a cloud-based logging service.
- Contrast Kedro with similar (competing) products and services and show me how the earlier-developed pipeline could be implemented in one of them.
I wrote a blog post with annotated responses to the answers I got to my questions. I was super impressed and decided to implement the Kedro pipeline and Streamlit application as planned from what I learned. My GitHub repository contains all the code for the application.
As you'll read in my blog post ChatGPT helps "understanding" and is why I found it useful for learning. The Kedro code ChatGPT generated was simplistic and in some cases wrong, but perfectly okay to get the gist of how it worked. My app is original, with small parts of it taken from Kedro's code template, so you're free to use it without any recourse under the MIT license.Try the Streamlit app yourself running in the Streamlit Cloud.
Streamlit App
- The source OCLH crypto currency data is supplied in a single CSV file, and was previously downloaded from the Bitfinex exchange
- OCLH data is for 4 coins spanning the period June 1, 2022 to December 31, 2022
- OCLH data is in 15min frequency
- A Kedro data catalog of source and feature datasets is built for each coin and subsequently used in the Kedro ML pipeline
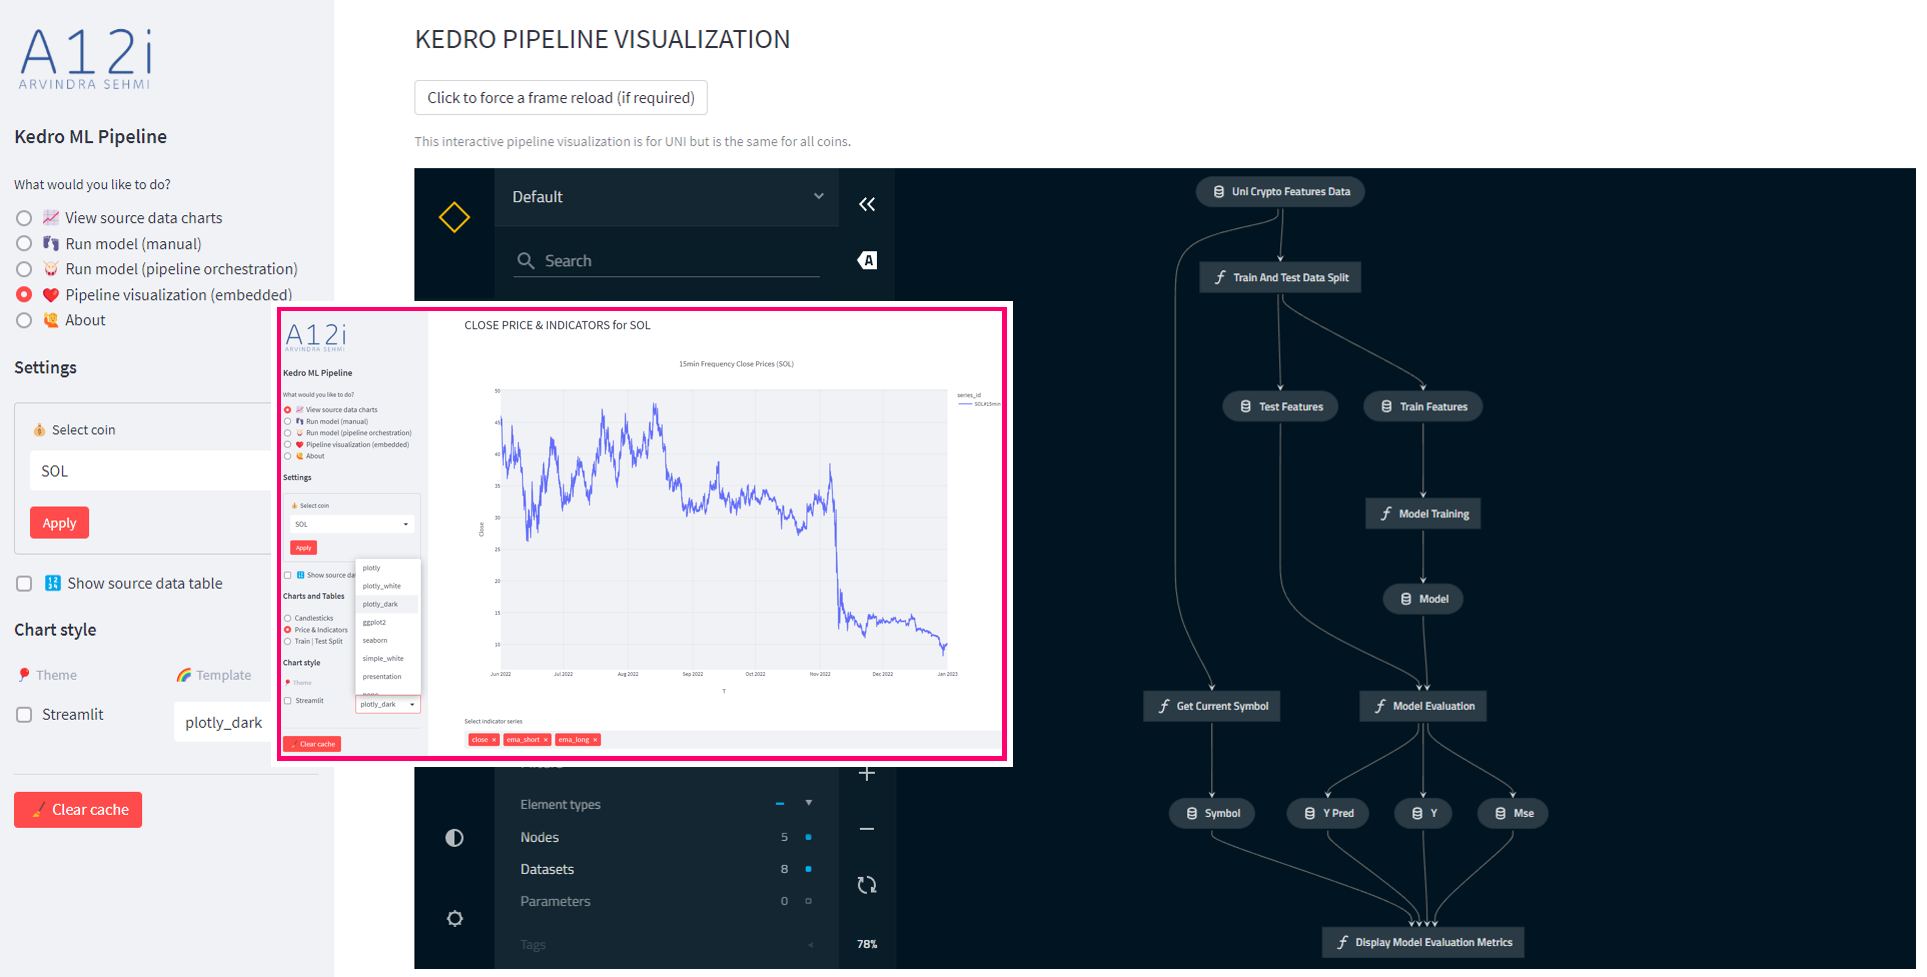
- You can run the Kedro ML pipeline to train, test and evaluate a Linear Regression model to predict next period (t+1) close prices from several feature techical indicators derived from the close price and volume
- You can visualize candlestick and line charts for the source and feature datasets, by coin
- Run locally, you can visualize an interactive graph representation of the Kedro pipeline in the Streamlit application
- You can run the pipeline nodes and the pipeline visualization from the command line too, using Kedro's CLI tools
For Streamlit beginners, this application can be useful to learn how to:
- Structure a multipage application
- Use session state
- Use widget callbacks
- Use many different widgets
- Launch sub-processes
- Embed external GUIs
- Cache data and clear caches
- Plotly charting
- (Check out my gists for more Streamlit goodies)

No comments:
Post a Comment